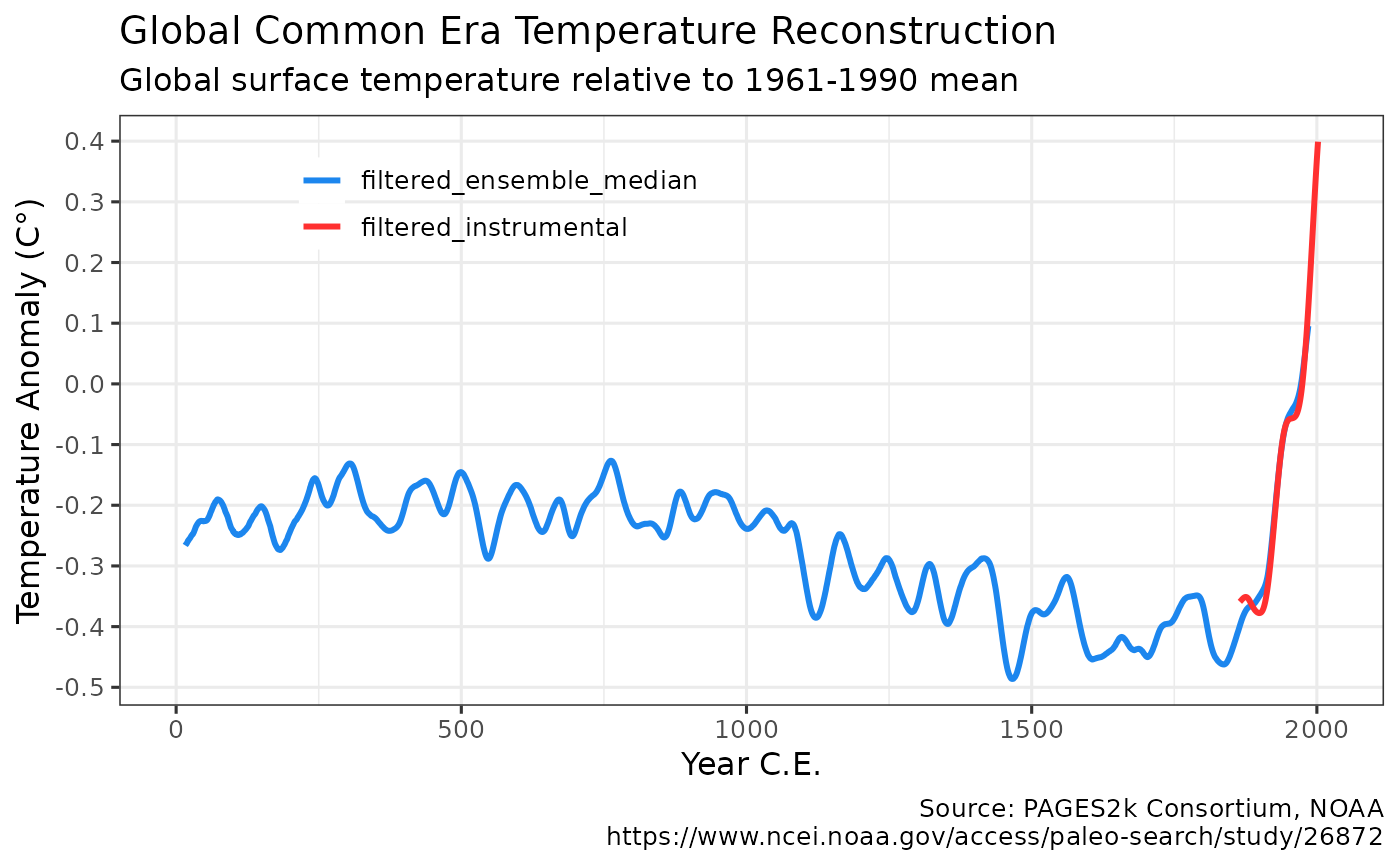
Plots the Common Era 2000-year global temperature anomaly retrieved using get_temp2k() with ggplot2. The output ggplot2 object may be further modified.
Usage
plot_temp2k(
  dataset = get_temp2k(),
  instrumental = TRUE,
  filtered = TRUE,
  print = TRUE
)
Arguments
- dataset
Name of the tibble generated by
get_temp2k- instrumental
(boolean) Include the Cowtan & Way instrumental temperatures through 2017. Defaults to TRUE.
- filtered
(boolean) Use the filtered temperatures provided by PAGES2k Consortium. Temperatures filtered using a 31-year Butterworth filter. Defaults to TRUE.
(boolean) Display temperature anomaly ggplot2 chart, defaults to TRUE. Use FALSE to not display chart.
Details
plot_temp2k invisibly returns a ggplot2 object with a pre-defined temperature anomaly chart using data from get_temp2k.
By default the chart is also displayed. Users may further modify the output ggplot2 chart.
Author
Hernando Cortina, hch@alum.mit.edu
Examples
# \donttest{
# Fetch temperature anomaly:
anomaly <- get_temp2k()
#
# Plot output using package's built-in ggplot2 defaults
plot_temp2k(anomaly)
 # Or just call plot_temp2k(), which defaults to get_temp2k() dataset
plot_temp2k()
# Or just call plot_temp2k(), which defaults to get_temp2k() dataset
plot_temp2k()
 p <- plot_temp2k(anomaly, print = FALSE)
# Modify plot such as: p + ggplot2::labs(title='Temperature Increase in the Common Era') # }
p <- plot_temp2k(anomaly, print = FALSE)
# Modify plot such as: p + ggplot2::labs(title='Temperature Increase in the Common Era') # }