Plots the monthly Sea Ice Index data retrieved using get_icecurves() with ggplot2. The output ggplot2 object may be further modified.
Usage
plot_icecurves(dataset = get_icecurves(), print = TRUE)Details
plot_icecurves invisibly returns a ggplot2 object with a pre-defined Sea Ice Index chart using data from get_icecurves.
By default the chart is also displayed. Users may further modify the output ggplot2 chart.
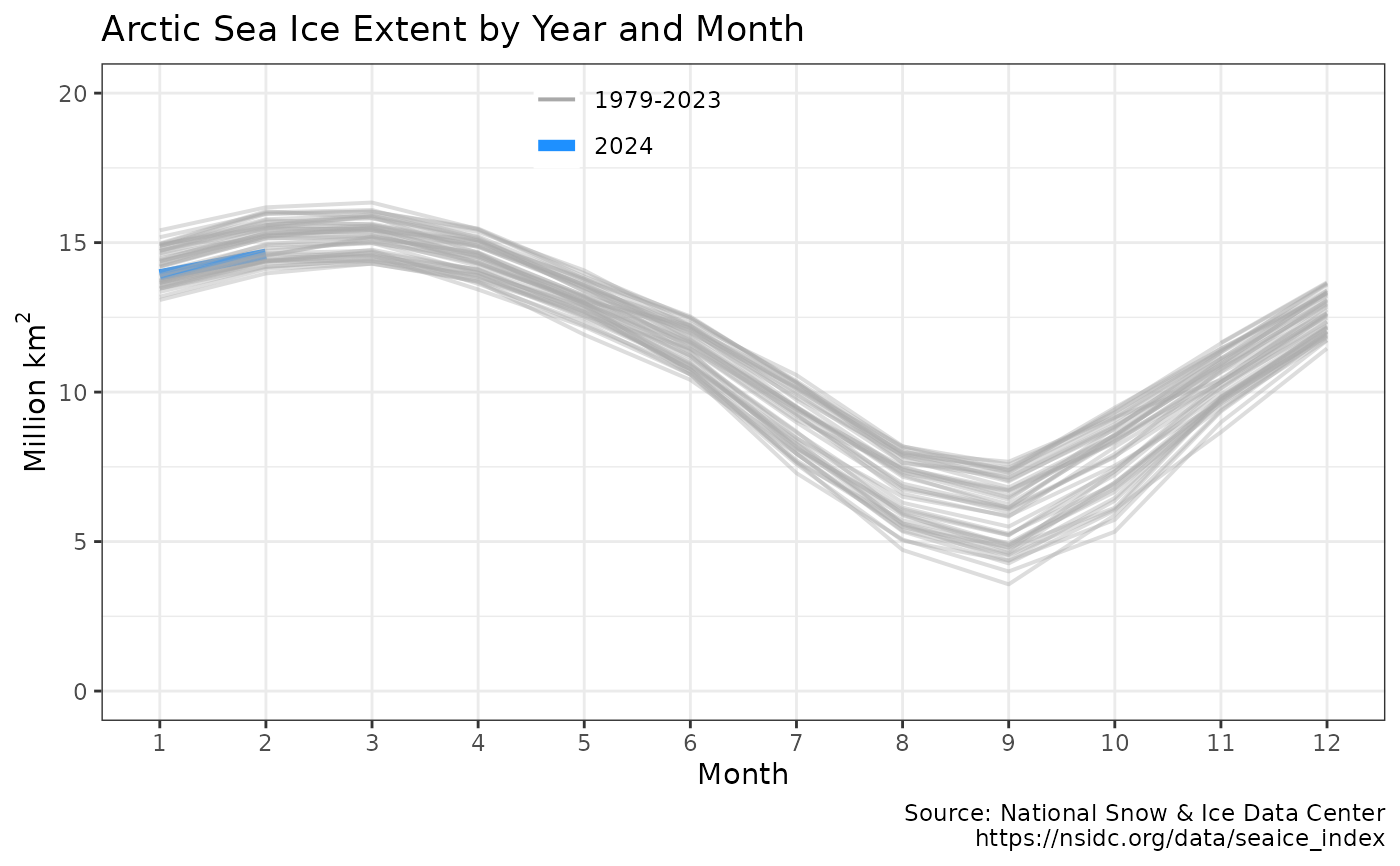
Chart consists of one line per year showing monthly sea ice from January through December. Current year is highlighted.
Author
Hernando Cortina, hch@alum.mit.edu
Examples
# \donttest{
# Fetch historic monthly sea ice data since 1979:
icecurves <- get_icecurves()
#
# Plot output using package's built-in ggplot2 defaults
plot_icecurves(icecurves)
 # Or just call plot_icecurves(), which defaults to get_icecurves() dataset
plot_icecurves()
# Or just call plot_icecurves(), which defaults to get_icecurves() dataset
plot_icecurves()
 p <- plot_icecurves(icecurves, print = FALSE)
# Modify plot such as: p + ggplot2::labs(title='Shrinking Arctic Sea Ice') # }
p <- plot_icecurves(icecurves, print = FALSE)
# Modify plot such as: p + ggplot2::labs(title='Shrinking Arctic Sea Ice') # }