Retrieves Arctic or Antarctic monthly Sea Ice Index time series (in million square km).
Source is the National Snow and Ice Data Center, defaults to Arctic (Northern Hemisphere) monthly sea ice extent since 1979.
https://nsidc.org/data/explore-data
Usage
get_icecurves(
  pole = "N",
  measure = "extent",
  use_cache = TRUE,
  write_cache = getOption("hs_write_cache")
)
Arguments
- pole
'N' for Arctic or 'S' for Antarctic
- measure
Must be 'extent' or 'area', defaults to 'extent'. Please see terminology link in references for details.
- use_cache
(boolean) Return cached data if available, defaults to TRUE. Use FALSE to fetch updated data, or to change pole or month in cache.
- write_cache
(boolean) Write data to cache, defaults to FALSE. Use TRUE to write data to cache for later use. Can also be set using options(hs_write_cache=TRUE)
Value
Invisibly returns a tibble with the series of monthly Sea Ice Index since 1979 (in million square km).
get_icecurves invisibly returns a tibble with time series of monthly Sea Ice Index since 1979 (in million square km).
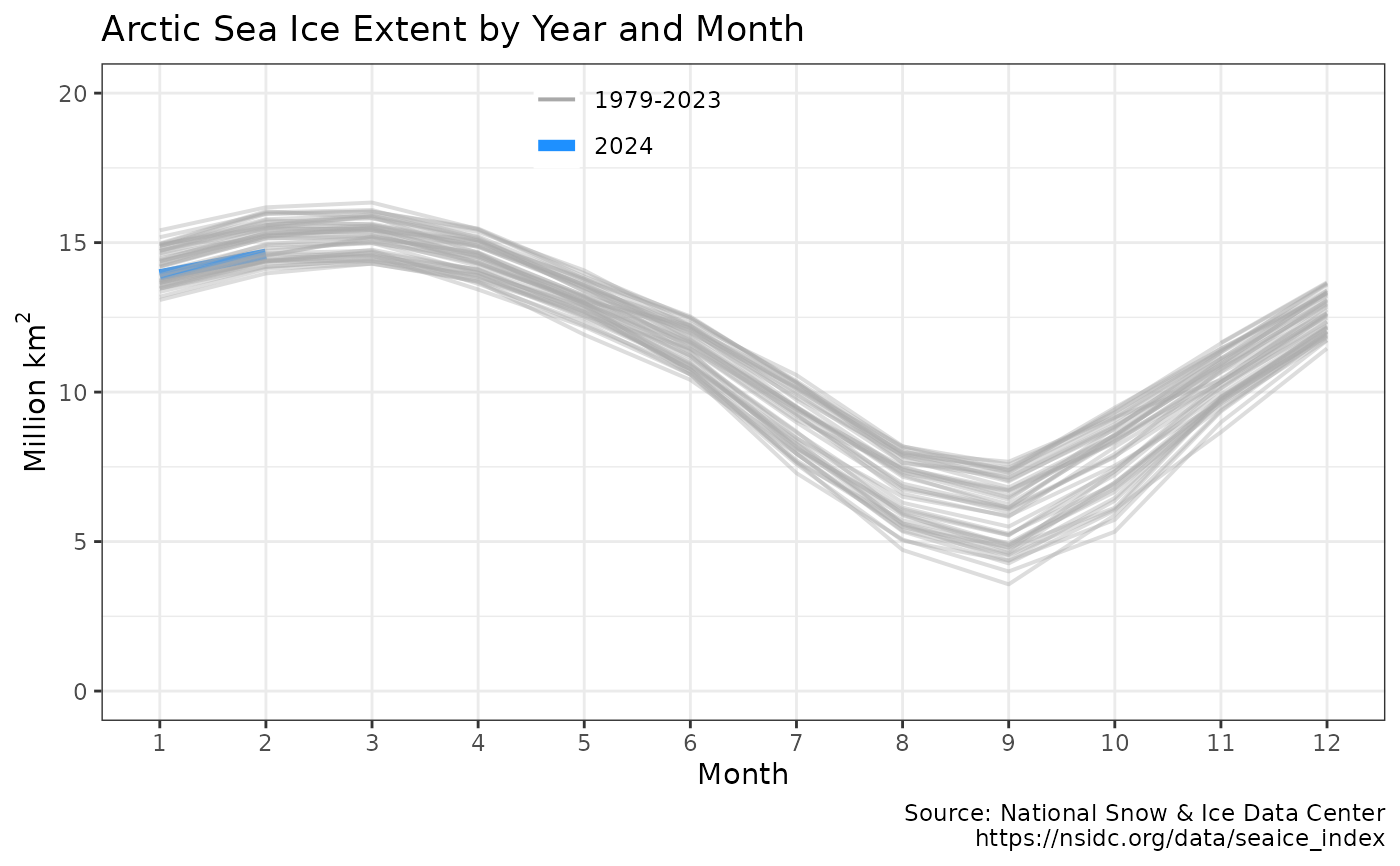
User may select monthly Arctic or Antarctic sea ice extent or area (in millions of square kilometers). Defaults to Arctic sea ice extent. https://nsidc.org/sea-ice-today/about-data#area_extent
References
NSIDC Data Archive: https://nsidc.org/data/explore-data
All About Sea Ice: https://nsidc.org/learn/parts-cryosphere/sea-ice
Sea Ice terminology: https://nsidc.org/learn
Author
Hernando Cortina, hch@alum.mit.edu
Examples
# \donttest{
# Fetch monthly sea ice history from cache if available:
icecurves <- get_icecurves()
#
# Force cache refresh:
icecurves <- get_icecurves(use_cache = FALSE)
# change region
south_icecurves <- get_icecurves(pole='S',  use_cache = FALSE)
#
# Review cache contents and last update dates:
hockeystick_cache_details()
#> <hockeystick cached files>
#>   directory: /home/runner/.cache/R/hockeystick
#>
#
# Plot output using package's built-in ggplot2 settings
plot_icecurves(icecurves) # }