Plots carbon dioxide emissions retrieved using get_emissions() with ggplot2. The output ggplot2 object may be modified. Alternative columns from the dataset may also be plotted.
Usage
plot_emissions(
  dataset = get_emissions(),
  start_year = 1900,
  region = "World",
  field = "co2",
  print = TRUE,
  annot = TRUE,
  title_expression = expression("Fossil Combustion " * CO[2] * " Emissions"),
  yaxis_expression = expression("Gt " * CO[2] * " per year")
)
Arguments
- dataset
Name of the tibble generated by
get_emissions- start_year
Year to start plot at. Defaults to 1900. Data is available since 1750.
- region
ISO code of region to plot. Defaults to 'OWID_WRL' which signifies entire world.
- field
Field from GCP dataset to be plotted, defaults to 'co2'
(boolean) Display carbon dioxide emissions ggplot2 chart, defaults to TRUE. Use FALSE to not display chart.
- annot
(boolean) Include chart annotation with latest date and value, defaults to TRUE.
- title_expression
Chart title, defaults to CO2 emissions
- yaxis_expression
y-axis label, defaults to Gt CO2 emissions
Details
plot_emissions invisibly returns a ggplot2 object with a pre-defined carbon dioxide emissions chart using data from get_emissions. Use the field parameter to select alternative columns from the data set such as co2_per_capita.
By default the chart is also displayed. Users may further modify the output ggplot2 chart.
Author
Hernando Cortina, hch@alum.mit.edu
Examples
# \donttest{
# Fetch carbon dioxide emissions:
emissions <- get_emissions()
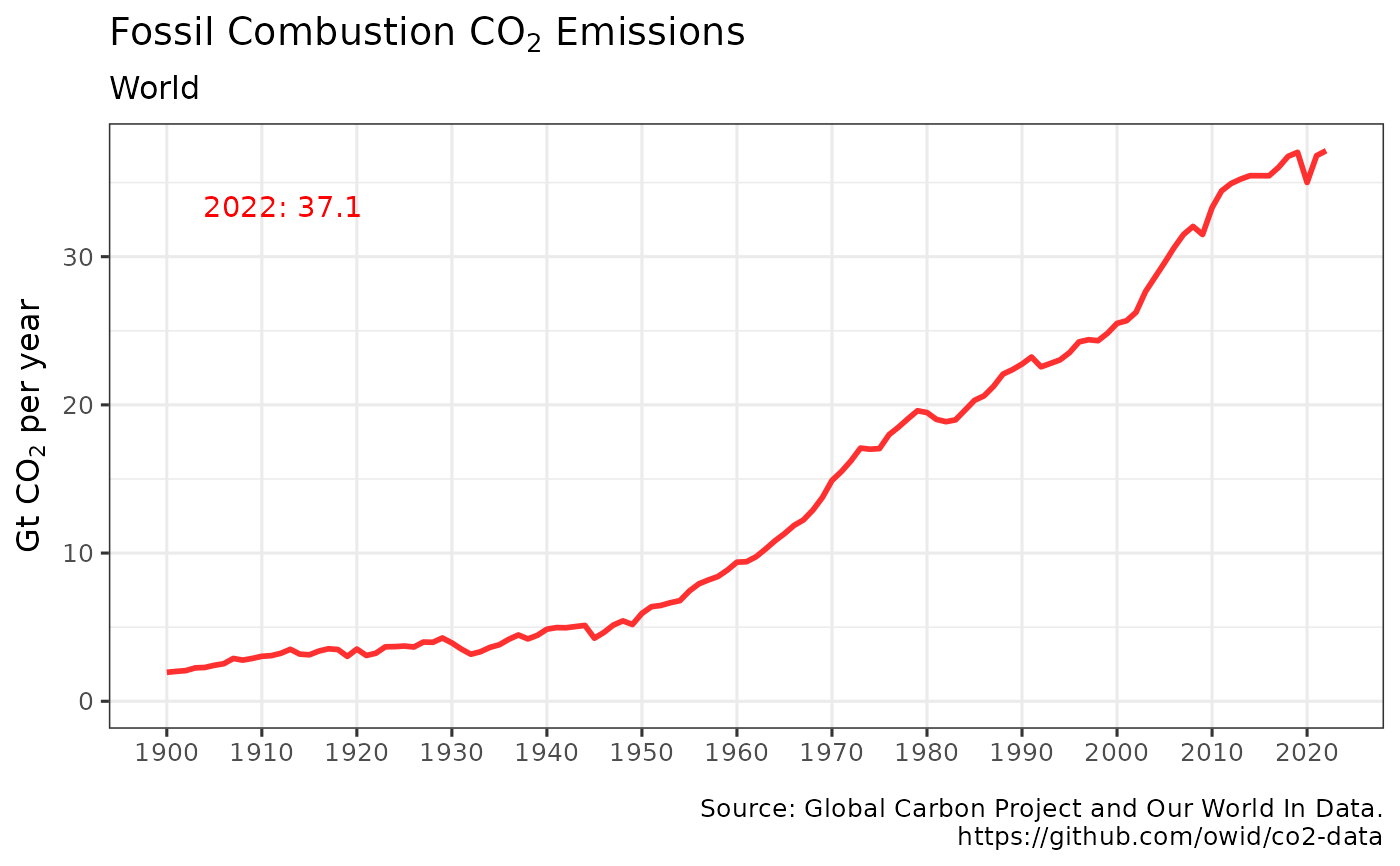
# Plot output using package's built-in ggplot2 defaults
plot_emissions(emissions)
 # Or just call plot_emissions(), which defaults to get_emissions() dataset
plot_emissions()
# Or just call plot_emissions(), which defaults to get_emissions() dataset
plot_emissions()
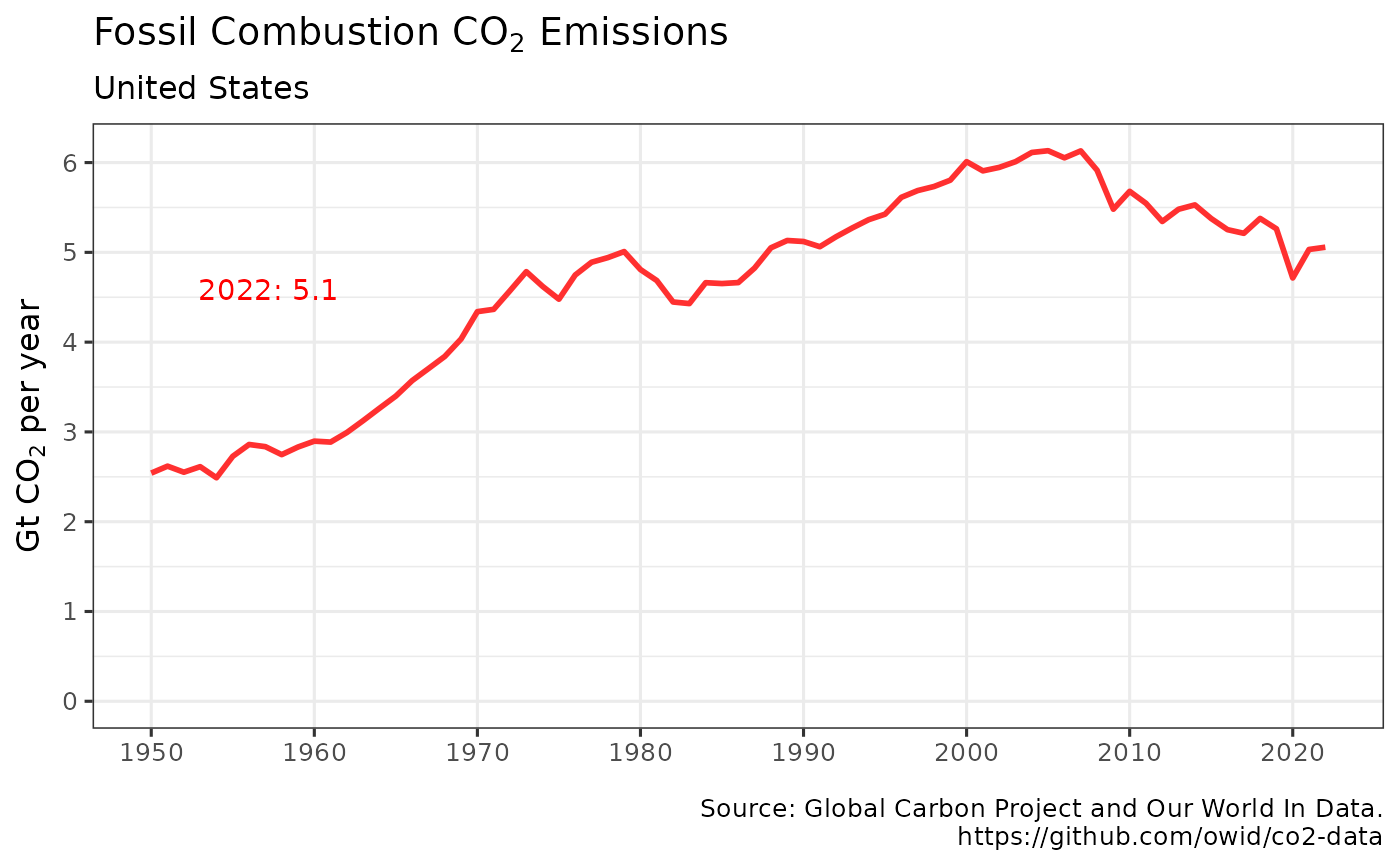
 # You can also select a region by name and start year
plot_emissions(region='United States', start_year=1950)
# You can also select a region by name and start year
plot_emissions(region='United States', start_year=1950)
 p <- plot_emissions(emissions, print = FALSE)
# Modify plot such as: p + ggplot2::labs(title='Anthropogenic Carbon Emissions')
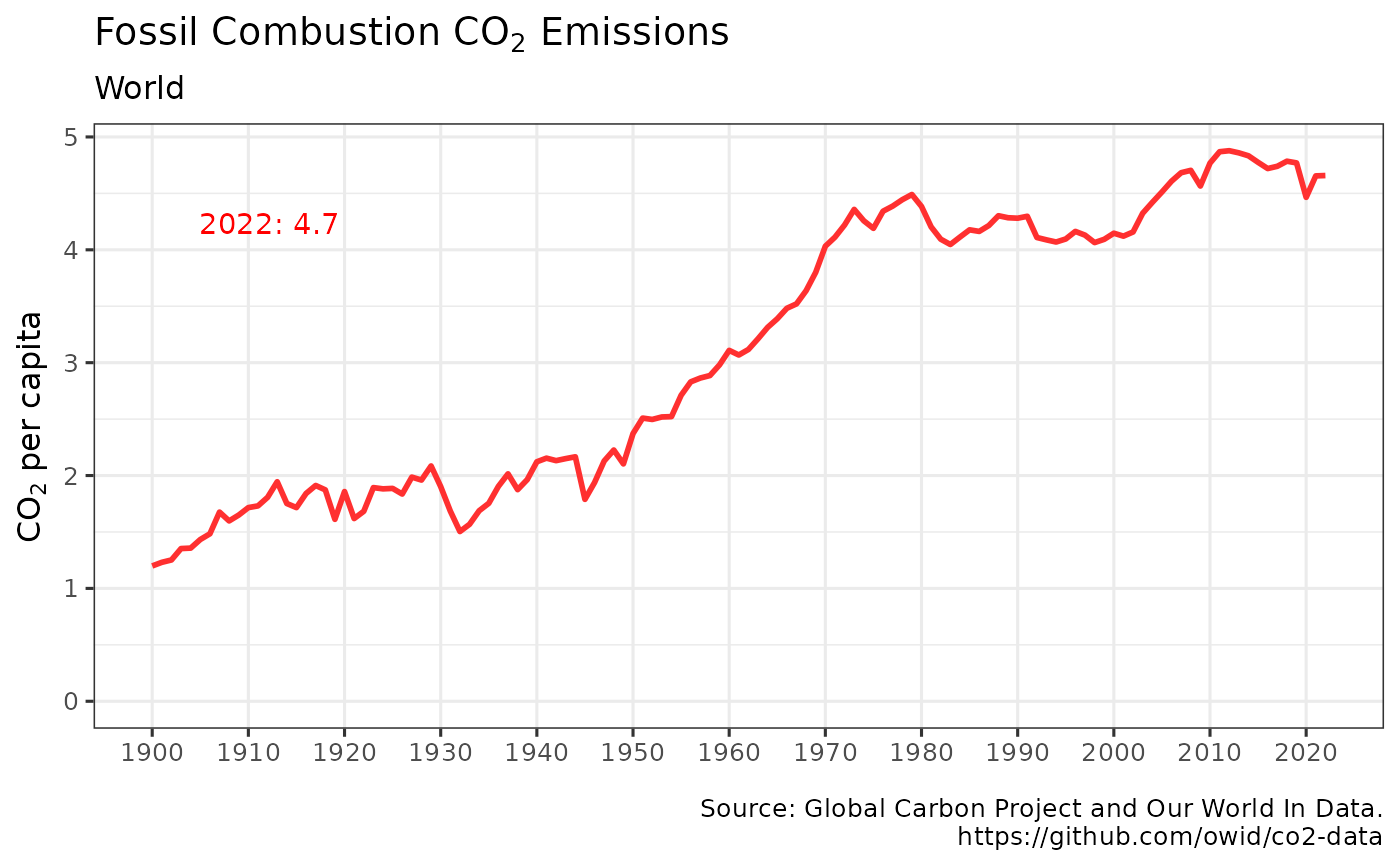
# Plot a different field from GCP dataset
plot_emissions(field='co2_per_capita', yaxis_expression=expression(CO[2]*' per capita' ))# }
p <- plot_emissions(emissions, print = FALSE)
# Modify plot such as: p + ggplot2::labs(title='Anthropogenic Carbon Emissions')
# Plot a different field from GCP dataset
plot_emissions(field='co2_per_capita', yaxis_expression=expression(CO[2]*' per capita' ))# }