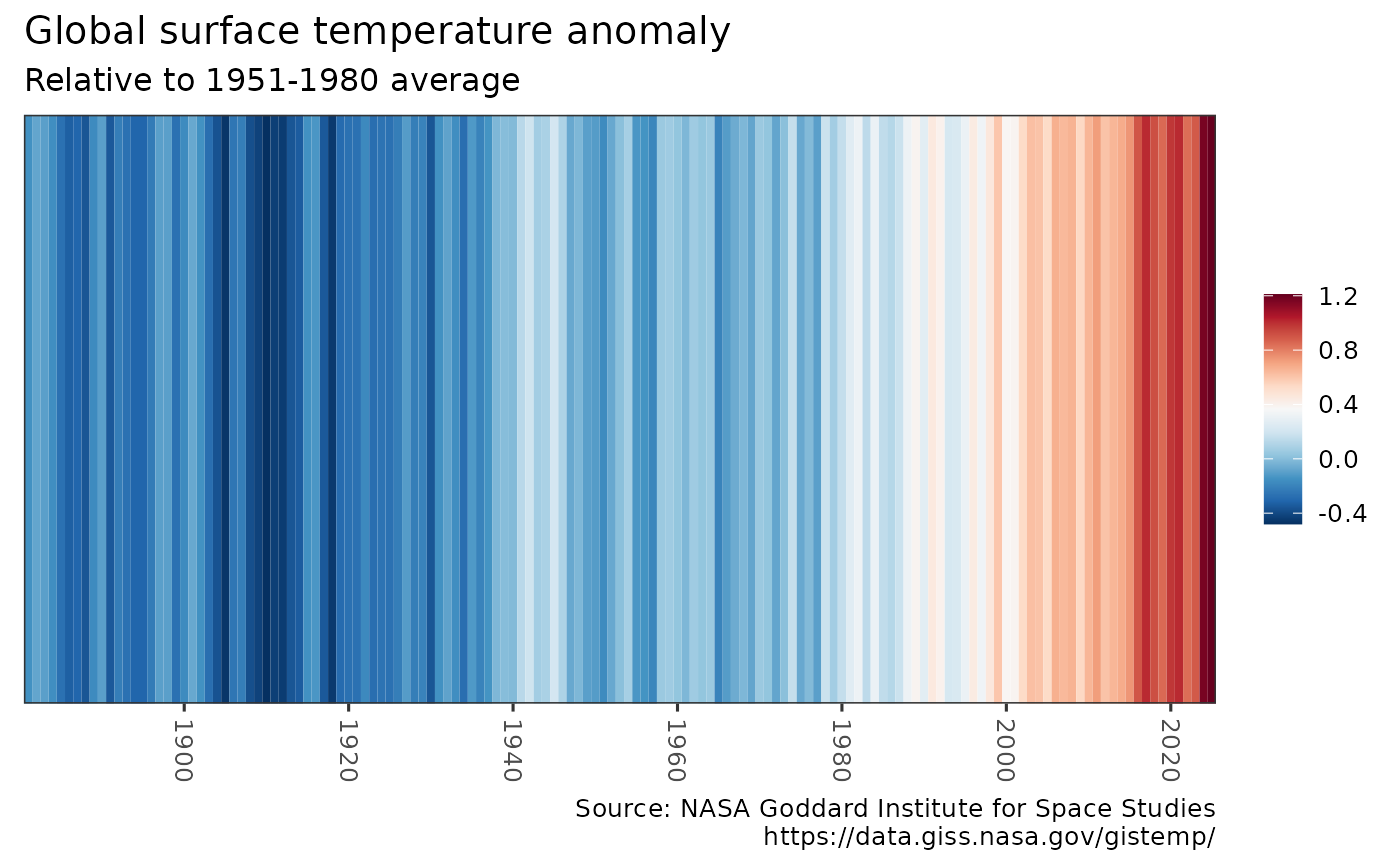
Plots global "warming stripes" graph in the style popularized by Ed Hawkins, based on temperature anomaly retrieved using get_temp().
Function can output stripes chart with legend or a minimal chart. The output ggplot2 object may be further modified.
Usage
warming_stripes(
  dataset = get_temp(),
  stripe_only = FALSE,
  col_strip = RColorBrewer::brewer.pal(11, "RdBu"),
  print = TRUE
)Details
warming_stripes invisibly returns a ggplot2 object with warming stripes chart using data from get_temp.
By default the chart is also displayed. User may modify color palette or remove axes and legend. Users may further modify the output ggplot2 chart.
References
Climate Lab. 2018. https://www.climate-lab-book.ac.uk/2018/warming-stripes/
GISS Surface Temperature Analysis (GISTEMP v4): https://data.giss.nasa.gov/gistemp/
GISTEMP Team, 2020: GISS Surface Temperature Analysis (GISTEMP), version 4. NASA Goddard Institute for Space Studies.
Dr. Dominic Roye blog post "How to Create Warming Stripes in R": https://dominicroye.github.io/en/2018/how-to-create-warming-stripes-in-r/
Author
Hernando Cortina, hch@alum.mit.edu
Examples
# \donttest{
# Draw with axes and legend
stripes <- warming_stripes()
 # Draw stripes only
stripes <- warming_stripes(stripe_only = TRUE)
# Draw stripes only
stripes <- warming_stripes(stripe_only = TRUE)
 # Don't display, store for further modifications
stripes <- warming_stripes(print = FALSE)
# Change color palette
stripes <- warming_stripes(stripe_only = TRUE, col_strip = viridisLite::viridis(11)) # }
# Don't display, store for further modifications
stripes <- warming_stripes(print = FALSE)
# Change color palette
stripes <- warming_stripes(stripe_only = TRUE, col_strip = viridisLite::viridis(11)) # }
