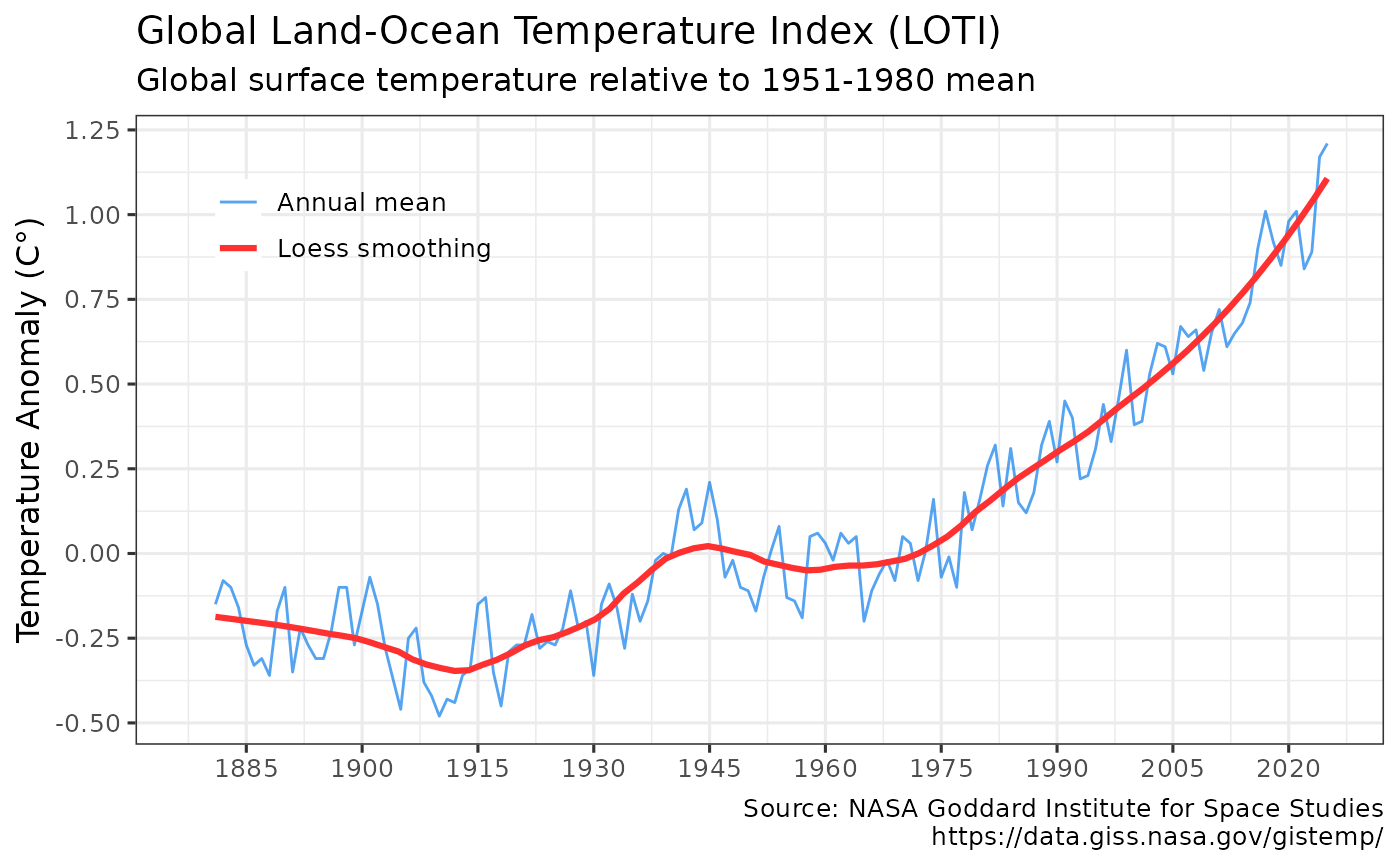
Plots the global annual mean temperature anomaly retrieved using get_temp() with ggplot2. The output ggplot2 object may be further modified.
Usage
plot_temp(dataset = get_temp(), print = TRUE)Details
plot_temp invisibly returns a ggplot2 object with a pre-defined temperature annual mean anomaly chart using data from get_temp.
By default the chart is also displayed. Smooths using ggplot2's built-in loess smoother. Users may further modify the output ggplot2 chart.
Author
Hernando Cortina, hch@alum.mit.edu
Examples
# \donttest{
# Fetch temperature anomaly:
anomaly <- get_temp()
#
# Plot output using package's built-in ggplot2 defaults
plot_temp(anomaly)
 # Or just call plot_temp(), which defaults to get_temp() dataset
plot_temp()
# Or just call plot_temp(), which defaults to get_temp() dataset
plot_temp()
 p <- plot_temp(anomaly, print = FALSE)
# Modify plot such as: p + ggplot2::labs(title='The Signature of Climate Change') # }
p <- plot_temp(anomaly, print = FALSE)
# Modify plot such as: p + ggplot2::labs(title='The Signature of Climate Change') # }