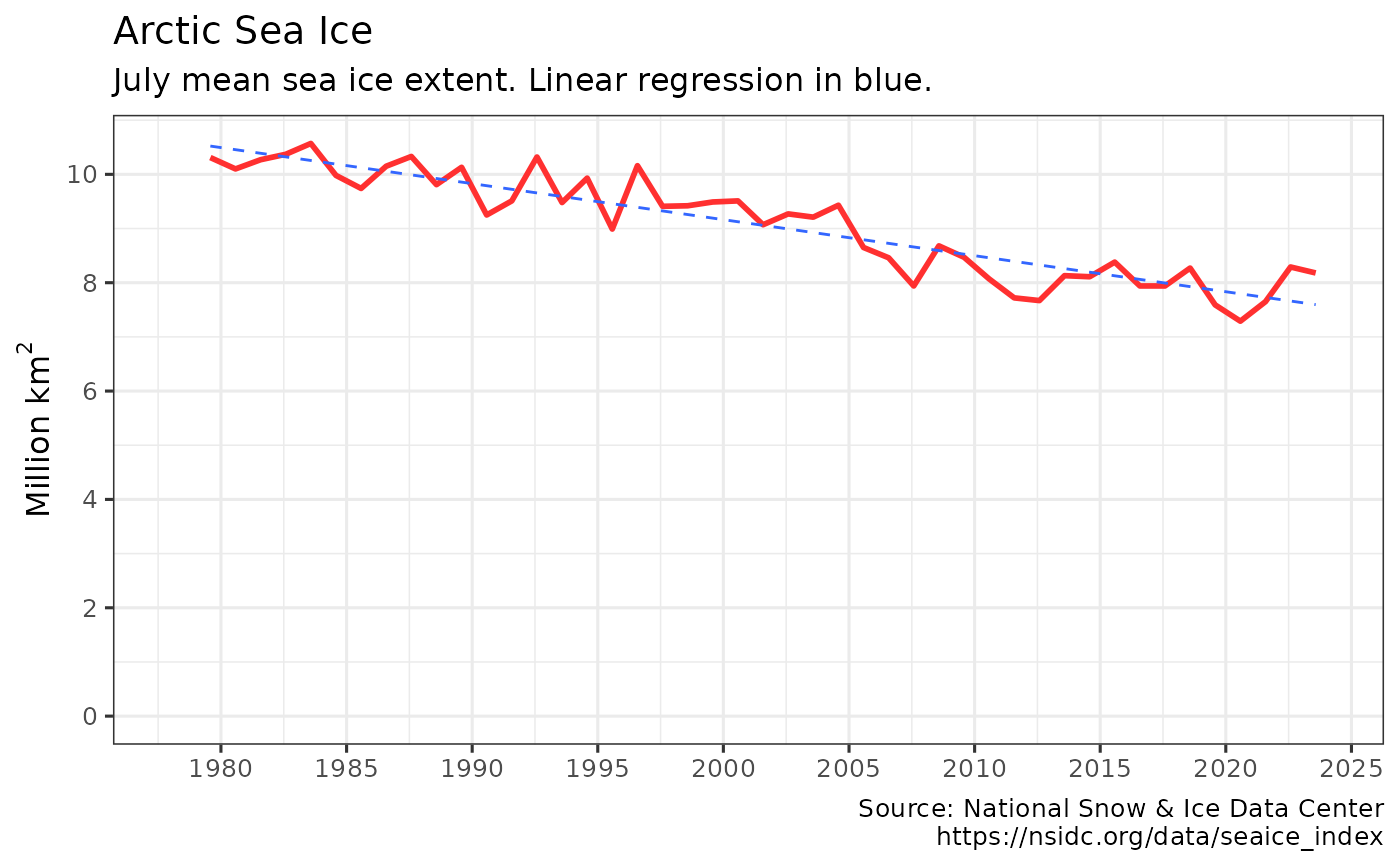
Plots the Sea Ice Index data retrieved using get_seaice() with ggplot2. The output ggplot2 object may be further modified.
Usage
plot_seaice(dataset = get_seaice(), title = "Arctic Sea Ice", print = TRUE)Details
plot_seaice invisibly returns a ggplot2 object with a pre-defined Sea Ice Index chart using data from get_seaice.
By default the chart is also displayed. Users may further modify the output ggplot2 chart.
Author
Hernando Cortina, hch@alum.mit.edu
Examples
# \donttest{
# Fetch sea ice data:
seaice <- get_seaice()
#> Please set use_cache=FALSE if you are changing pole, month, or measure from last cached data.
#
# Plot output using package's built-in ggplot2 defaults
plot_seaice(seaice)
 # Or just call plot_seaice(), which defaults to get_seaice() dataset
plot_seaice()
#> Please set use_cache=FALSE if you are changing pole, month, or measure from last cached data.
# Or just call plot_seaice(), which defaults to get_seaice() dataset
plot_seaice()
#> Please set use_cache=FALSE if you are changing pole, month, or measure from last cached data.
 p <- plot_seaice(seaice, print = FALSE)
# Modify plot such as: p + ggplot2::labs(title='Shrinking Arctic Sea Ice') # }
p <- plot_seaice(seaice, print = FALSE)
# Modify plot such as: p + ggplot2::labs(title='Shrinking Arctic Sea Ice') # }