Plots the Vostok ice core data retrieved using get_paleo() with ggplot2. The output ggplot2 object may be further modified.
Usage
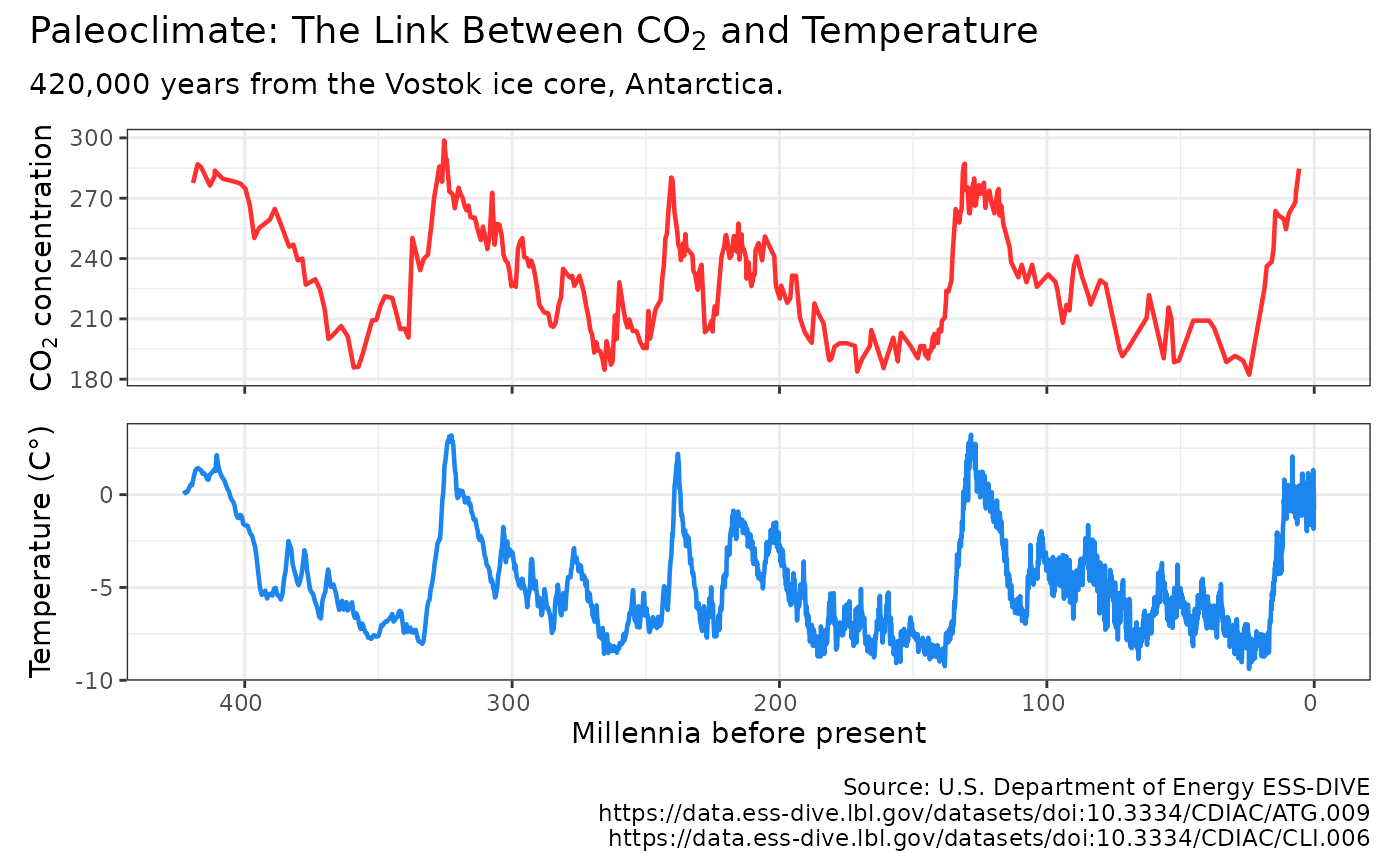
plot_paleo(dataset = get_paleo(), print = TRUE)Details
plot_paleo invisibly returns a ggplot2 object with a pre-defined Vostok ice core chart using data from get_paleo.
The returned chart stacks carbon dioxide concentration over temperature over 420,000 years.
By default the chart is also displayed. Users may further modify the output ggplot2 chart.
References
Barnola, J.-M., D. Raynaud, C. Lorius, and N.I. Barkov. 2003. Historical CO2 record from the Vostok ice core. In Trends: A Compendium of Data on Global Change. Carbon Dioxide Information Analysis Center, Oak Ridge National Laboratory, U.S. Department of Energy, Oak Ridge, Tenn., U.S.A
Author
Hernando Cortina, hch@alum.mit.edu
Examples
# \donttest{
# Fetch Vostok data:
vostok <- get_paleo()
#
# Plot output using package's built-in ggplot2 defaults
plot_paleo(vostok)
 # Or just call plot_paleo(), which defaults to get_paleo() dataset
plot_paleo()
# Or just call plot_paleo(), which defaults to get_paleo() dataset
plot_paleo()
 p <- plot_paleo(vostok, print = FALSE)
# Modify plot such as: p + patchwork::plot_annotation(title='A Long History of Carbon') # }
p <- plot_paleo(vostok, print = FALSE)
# Modify plot such as: p + patchwork::plot_annotation(title='A Long History of Carbon') # }