Plots the hurricane data retrieved using get_hurricanes() with ggplot2. The output ggplot2 object may be further modified.
Usage
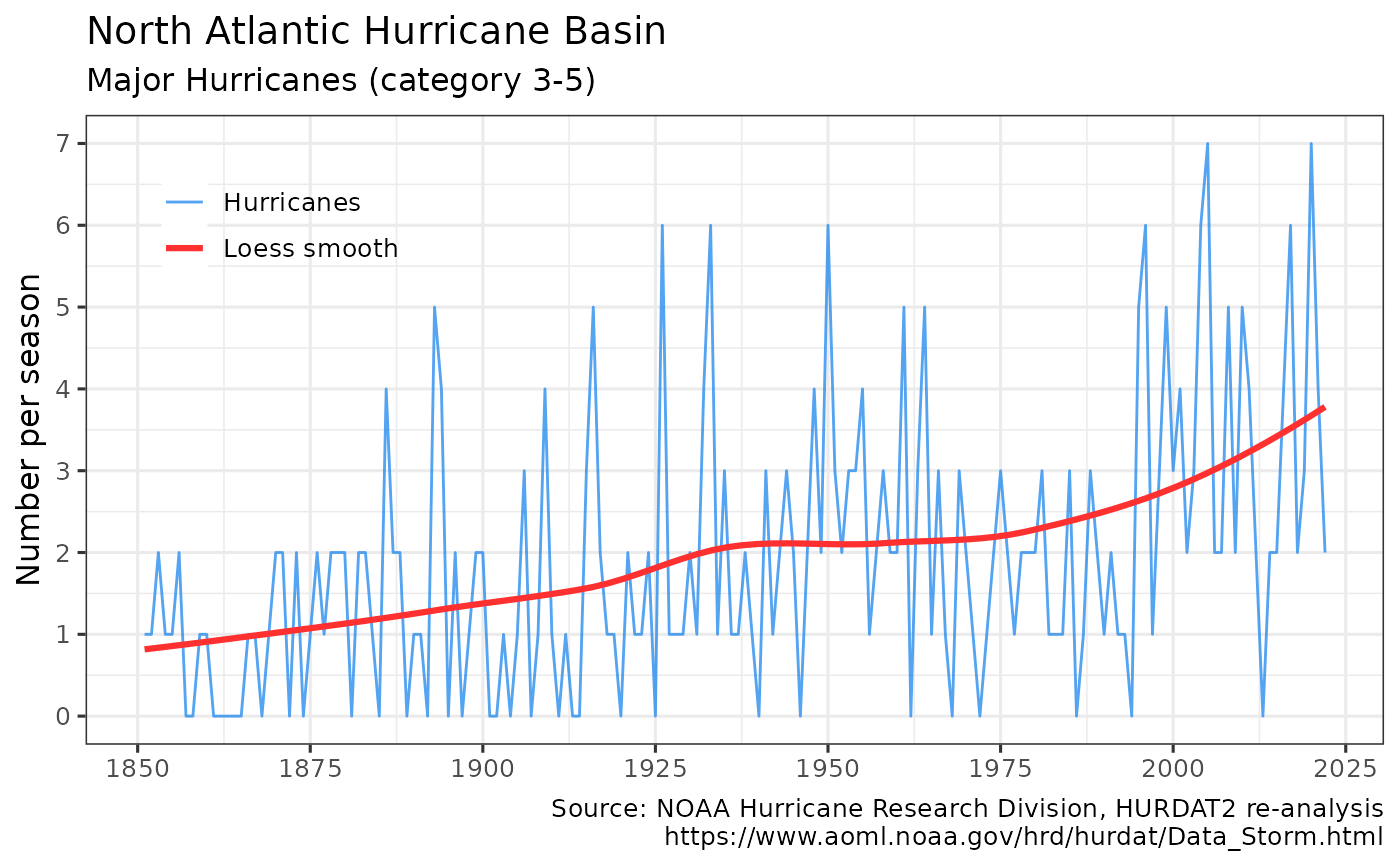
plot_hurricanes(dataset = get_hurricanes(), cat = "major", print = TRUE)Details
plot_hurricanes invisibly returns a ggplot2 object with a pre-defined hurricane data chart using data from get_hurricanes.
By default the chart is also displayed. Smooths using ggplot2's built-in loess smoother. Users may further modify the output ggplot2 chart.
Categories may be "major" (category 3-5), "hurricane" (category 1-5), or "storm" (named storm).
Author
Hernando Cortina, hch@alum.mit.edu
Examples
# \donttest{
# Fetch hurricane data:
hurricanes <- get_hurricanes()
#
# Plot output using package's built-in ggplot2 defaults
plot_hurricanes(hurricanes)
 # Or just call plot_hurricanes(), which defaults to get_hurricanes() dataset
plot_hurricanes()
# Or just call plot_hurricanes(), which defaults to get_hurricanes() dataset
plot_hurricanes()
 p <- plot_hurricanes(hurricanes, print = FALSE)
# Modify plot such as: p + ggplot2::labs(title='Growing number of North Atlantic named storms') # }
p <- plot_hurricanes(hurricanes, print = FALSE)
# Modify plot such as: p + ggplot2::labs(title='Growing number of North Atlantic named storms') # }