Plots the hurricane energy data (ACE) retrieved using get_hurricanes() with ggplot2. The output ggplot2 object may be further modified.
Usage
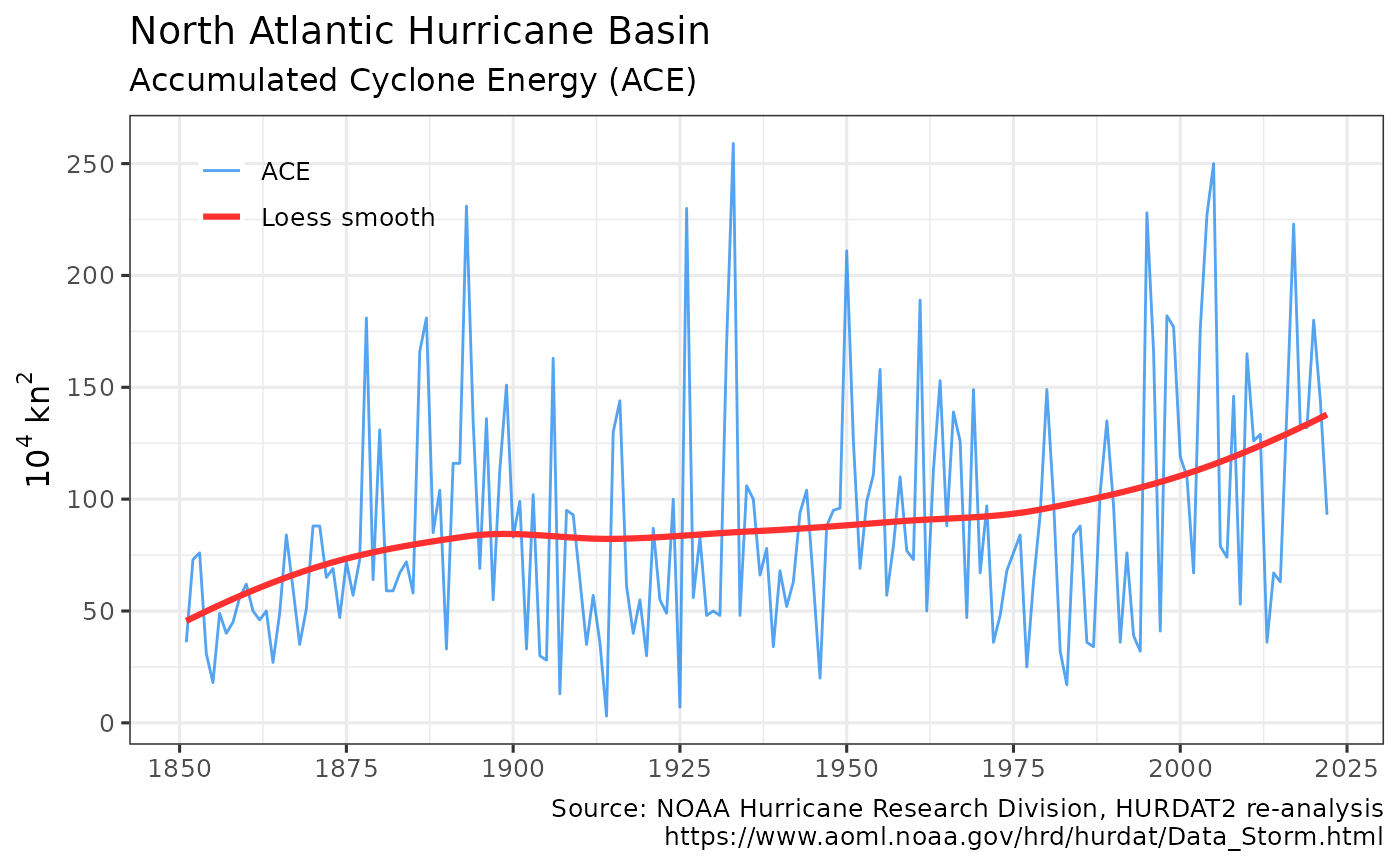
plot_hurricane_nrg(dataset = get_hurricanes(), print = TRUE)Details
plot_hurricane_nrg invisibly returns a ggplot2 object with a pre-defined hurricane energy data chart using data from get_hurricanes.
By default the chart is also displayed. Smooths using ggplot2's built-in loess smoother. Users may further modify the output ggplot2 chart.
ACE is an index that combines the number of systems, how long they existed and how intense they became. It is calculated by squaring the maximum sustained surface wind in the system every six hours that the cyclone is a Named Storm and summing it up for the season. Please refer to above website for details.
Author
Hernando Cortina, hch@alum.mit.edu
Examples
# \donttest{
# Fetch hurricane data:
hurricanes <- get_hurricanes()
#
# Plot output using package's built-in ggplot2 defaults
plot_hurricane_nrg(hurricanes)
 # Or just call plot_hurricane_nrg(), which defaults to get_hurricanes() dataset
plot_hurricane_nrg()
# Or just call plot_hurricane_nrg(), which defaults to get_hurricanes() dataset
plot_hurricane_nrg()
 p <- plot_hurricane_nrg(hurricanes, print = FALSE)
# Modify plot such as: p + ggplot2::labs(title='Accumulated Cyclone Energy') # }
p <- plot_hurricane_nrg(hurricanes, print = FALSE)
# Modify plot such as: p + ggplot2::labs(title='Accumulated Cyclone Energy') # }