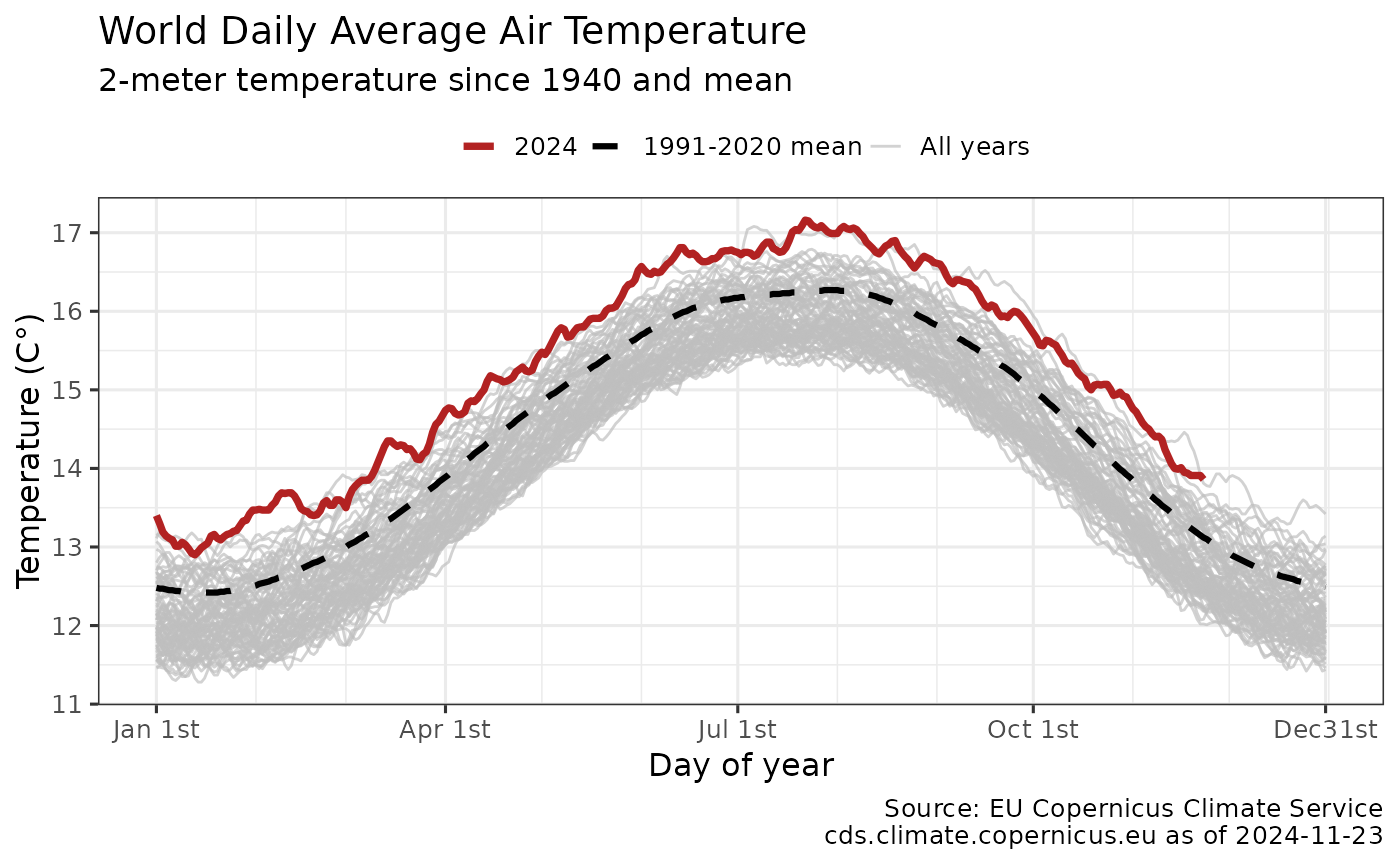
Retrieves the daily air temperature since 1940 from the EU Copernicus Service https://cds.climate.copernicus.eu/#!/home
Usage
get_dailytempcop(
  use_cache = TRUE,
  write_cache = getOption("hs_write_cache"),
  region = "W"
)
Arguments
- use_cache
(boolean) Return cached data if available, defaults to TRUE. Use FALSE to fetch updated data.
- write_cache
(boolean) Write data to cache, defaults to FALSE. Use TRUE to write data to cache for later use. Can also be set using options(hs_write_cache=TRUE)
- region
(string) Region selection, defaults to world air temperature. Options are: World Air "W".
Value
Invisibly returns a tibble with the daily 2-meter air temperatures since 1940 as well as historic mean by day-of-year and current anomaly versus mean.
get_dailytempcop invisibly returns a tibble with the daily temperatures since 1940 as well as mean by day-of-year and anomaly.
Region options include world air (default). The historic daily mean-by-day period defaults to 1991-2020.
Data are updated daily.
References
Copernicus: https://cds.climate.copernicus.eu/#!/home
Notes: daily mean surface air temperature (2-meter height) estimates from the ECMWF Reanalysis version 5 (ERA5) for the period January 1940 to present. ERA5 is a state-of-the-art numerical climate/weather modeling framework that ingests surface, radiosonde, and satellite observations to estimate the state of the atmosphere through time. ERA5 files have a horizontal grid resolution of 0.25° x 0.25° (about 31km x 31km at 45°N). Each daily temperature represents an average across all model gridcells within the defined latitude/longitude bounds for the selected domain. The means are area-weighted to account for the convergence of longitude lines at the poles
Author
Hernando Cortina, hch@alum.mit.edu
Examples
# \donttest{
# Fetch temp anomaly from cache if available:
dailytemps <- get_dailytempcop()
#
# Force cache refresh:
dailytemps <- get_dailytempcop(use_cache=FALSE)
#
# Review cache contents and last update dates:
hockeystick_cache_details()
#> <hockeystick cached files>
#>   directory: /home/runner/.cache/R/hockeystick
#>
#
# Plot output using package's built-in ggplot2 settings
plot_dailytemp(dailytemps) # }

