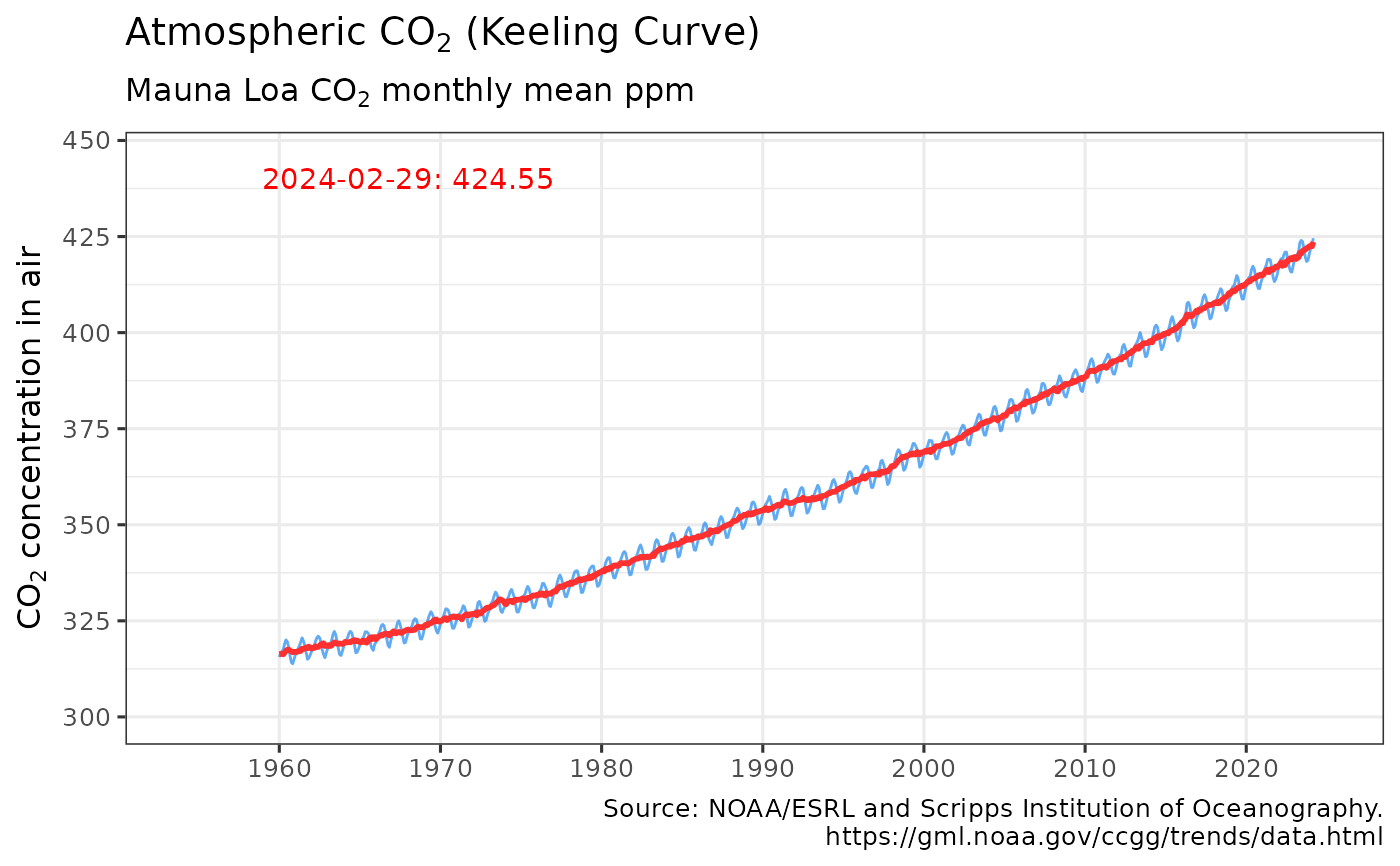
Retrieves atmospheric carbon dioxide measurements from National Oceanic and Atmospheric Administration Earth System Research Laboratories monitoring laboratory in Mauna Loa, Hawaii. https://gml.noaa.gov/ccgg/trends/data.html
Usage
get_carbon(use_cache = TRUE, write_cache = getOption("hs_write_cache"))Details
get_carbon invisibly returns a tibble with NOAA's monthly average carbon dioxide measurement.
The returned object includes date, year, month, average, trend, std dev, and uncertainty columns.
Trend is NOAA's published trend. Please refer to above website for details.
References
Dr. Pieter Tans, NOAA/GML https://gml.noaa.gov/ccgg/trends/ and Dr. Ralph Keeling, Scripps Institution of Oceanography https://scrippsco2.ucsd.edu/.
C.D. Keeling, R.B. Bacastow, A.E. Bainbridge, C.A. Ekdahl, P.R. Guenther, and L.S. Waterman, (1976), Atmospheric carbon dioxide variations at Mauna Loa Observatory, Hawaii, Tellus, vol. 28, 538-551
Author
Hernando Cortina, hch@alum.mit.edu
Examples
# \donttest{
# Fetch from cache if available, otherwise download:
maunaloa <- get_carbon()
#
# Force fetch from source:
maunaloa <- get_carbon(use_cache=FALSE)
#
# Review cache contents and last update dates:
hockeystick_cache_details()
#> <hockeystick cached files>
#>   directory: /home/runner/.cache/R/hockeystick
#>
#
# Plot output using package's built-in ggplot2 settings
plot_carbon(maunaloa) # }