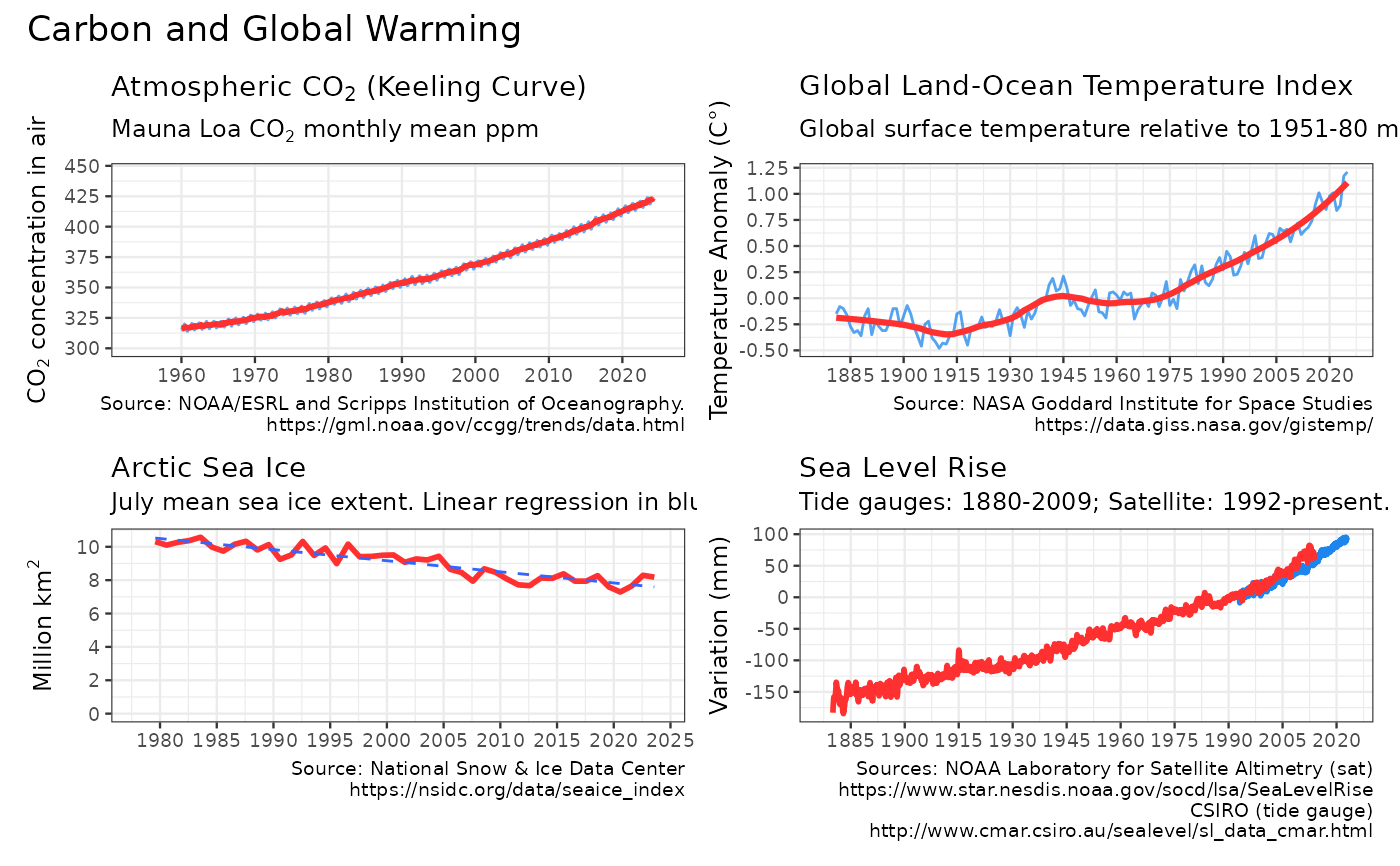
Plots a 2x2 grid of carbon, temperature, sea ice, and sea level charts.
Details
warming_stripes invisibly returns a ggplot2 object with 2x2 grid of carbon, temperature, sea ice, and sea level charts from get_carbon, get_temp, get_seaice, and get_sealevel.
By default the chart is also displayed. Users may further modify the output ggplot2 chart.
Author
Hernando Cortina, hch@alum.mit.edu